
What comes to mind when you’re on a website and nothing seems to be happening—for a considerable amount of time? You’re probably wondering—is this website broken? In most cases, it’s likely not, but it takes far too long for any content to appear on your screen. Then, there’s finally some activity on your screen, you relax, assured that the website isn’t broken.
The time it takes for that content to show on your screen is known as the First Contentful Paint (FCP).
In this article, we’ll do a deep dive on this metric and how to measure and optimize it for a good user experience. We’ll also look at some common causes of FCP delays and how you can avoid them.
What is First Contentful Paint (FCP)?
First Contentful Paint (FCP) is a user-centric metric that measures the time it takes the browser to render the first piece of DOM content (SVG, image (including background images), text, or non-white canvas) on a page.
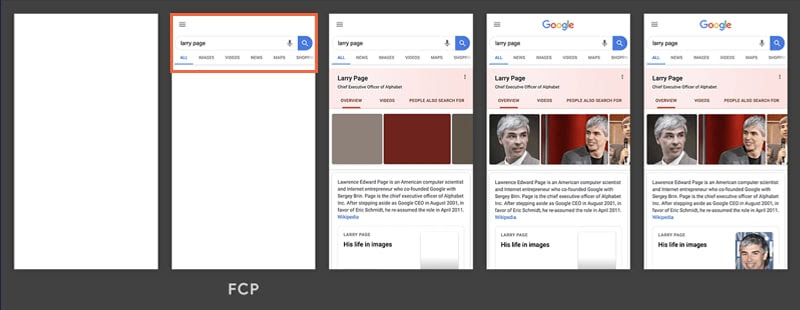
In other words, FCP is the total time taken between your initial page load event to the point any content renders on a user’s screen. It answers the question, “is the page loading or not?”
As one of Google’s web performance metrics, the FCP contrasts with other technical or quantitative metrics. The concept of FCP is based on “user experience” i.e., providing feedback to user’s input when they’re on your website. This way, they can perceive a change in your website’s layout, giving them the impression it’s responsive.
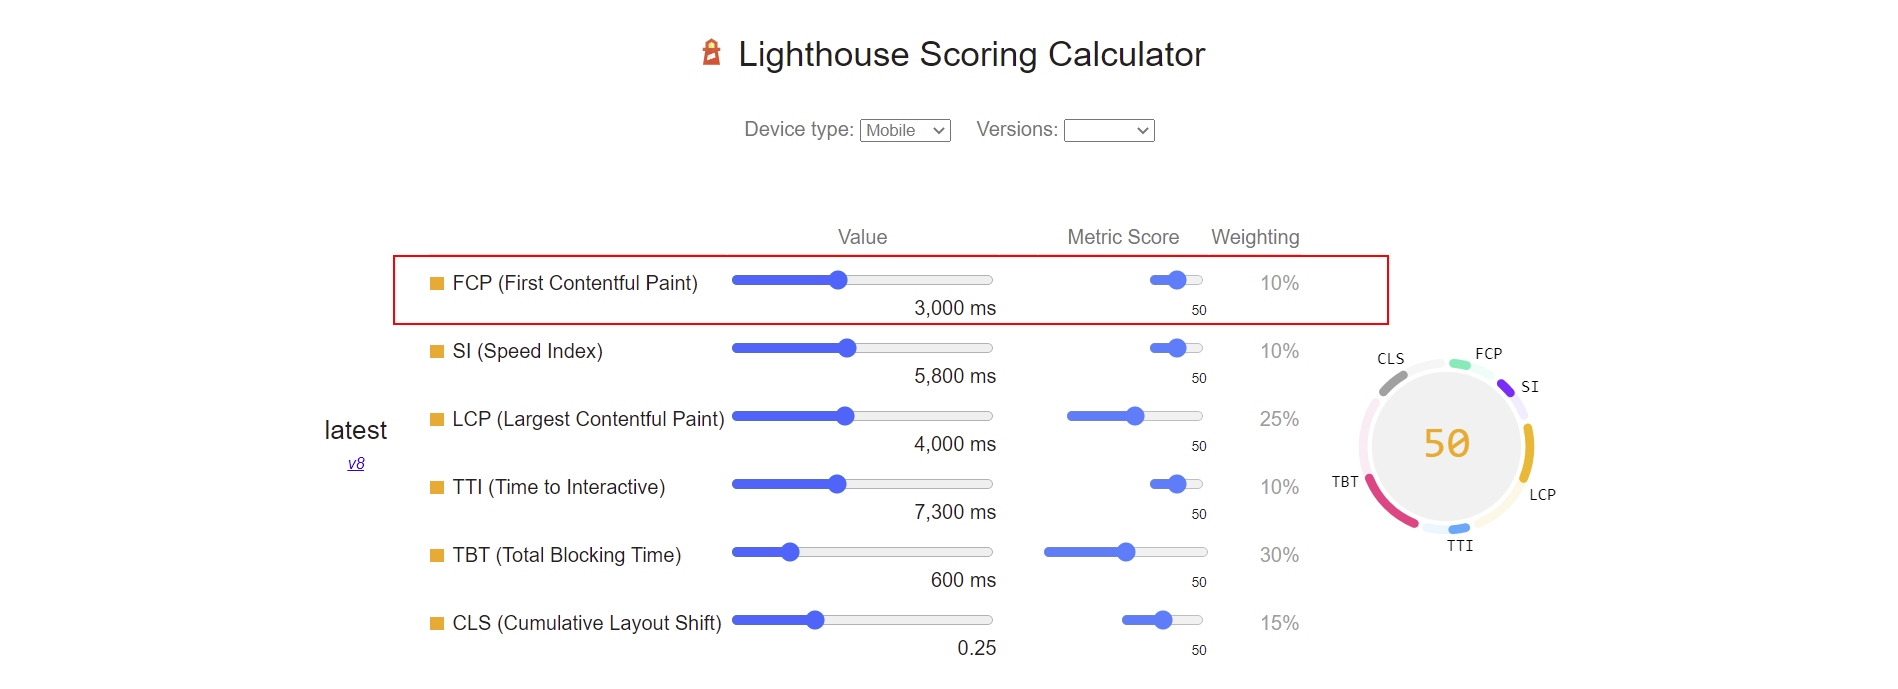
According to Lighthouse, the first contentful paint accounts for 10% of the overall performance of a website.
So, to have a fast website, you need to optimize your FCP to give the best user experience. On the other hand, different elements are likely to trigger your FCP and provide a good or bad user experience depending on the page load event.
A quick example is a loading animation on your website; if this pops up on a user’s screen and the website doesn’t fully load in the next few seconds, it gives a bad impression.

This is why FCP is considered one of the metrics based on perceived load speed, because it’s based solely on the user’s experience when the website loads. There’s a common misconception between the first contentful paint, first paint, and largest contentful paint due to how these metrics are focused on how websites render for users.
Difference Between The First Contentful Paint and First Paint
The FCP takes on two phases before it happens:
- The First Paint
- The Contentful Paint
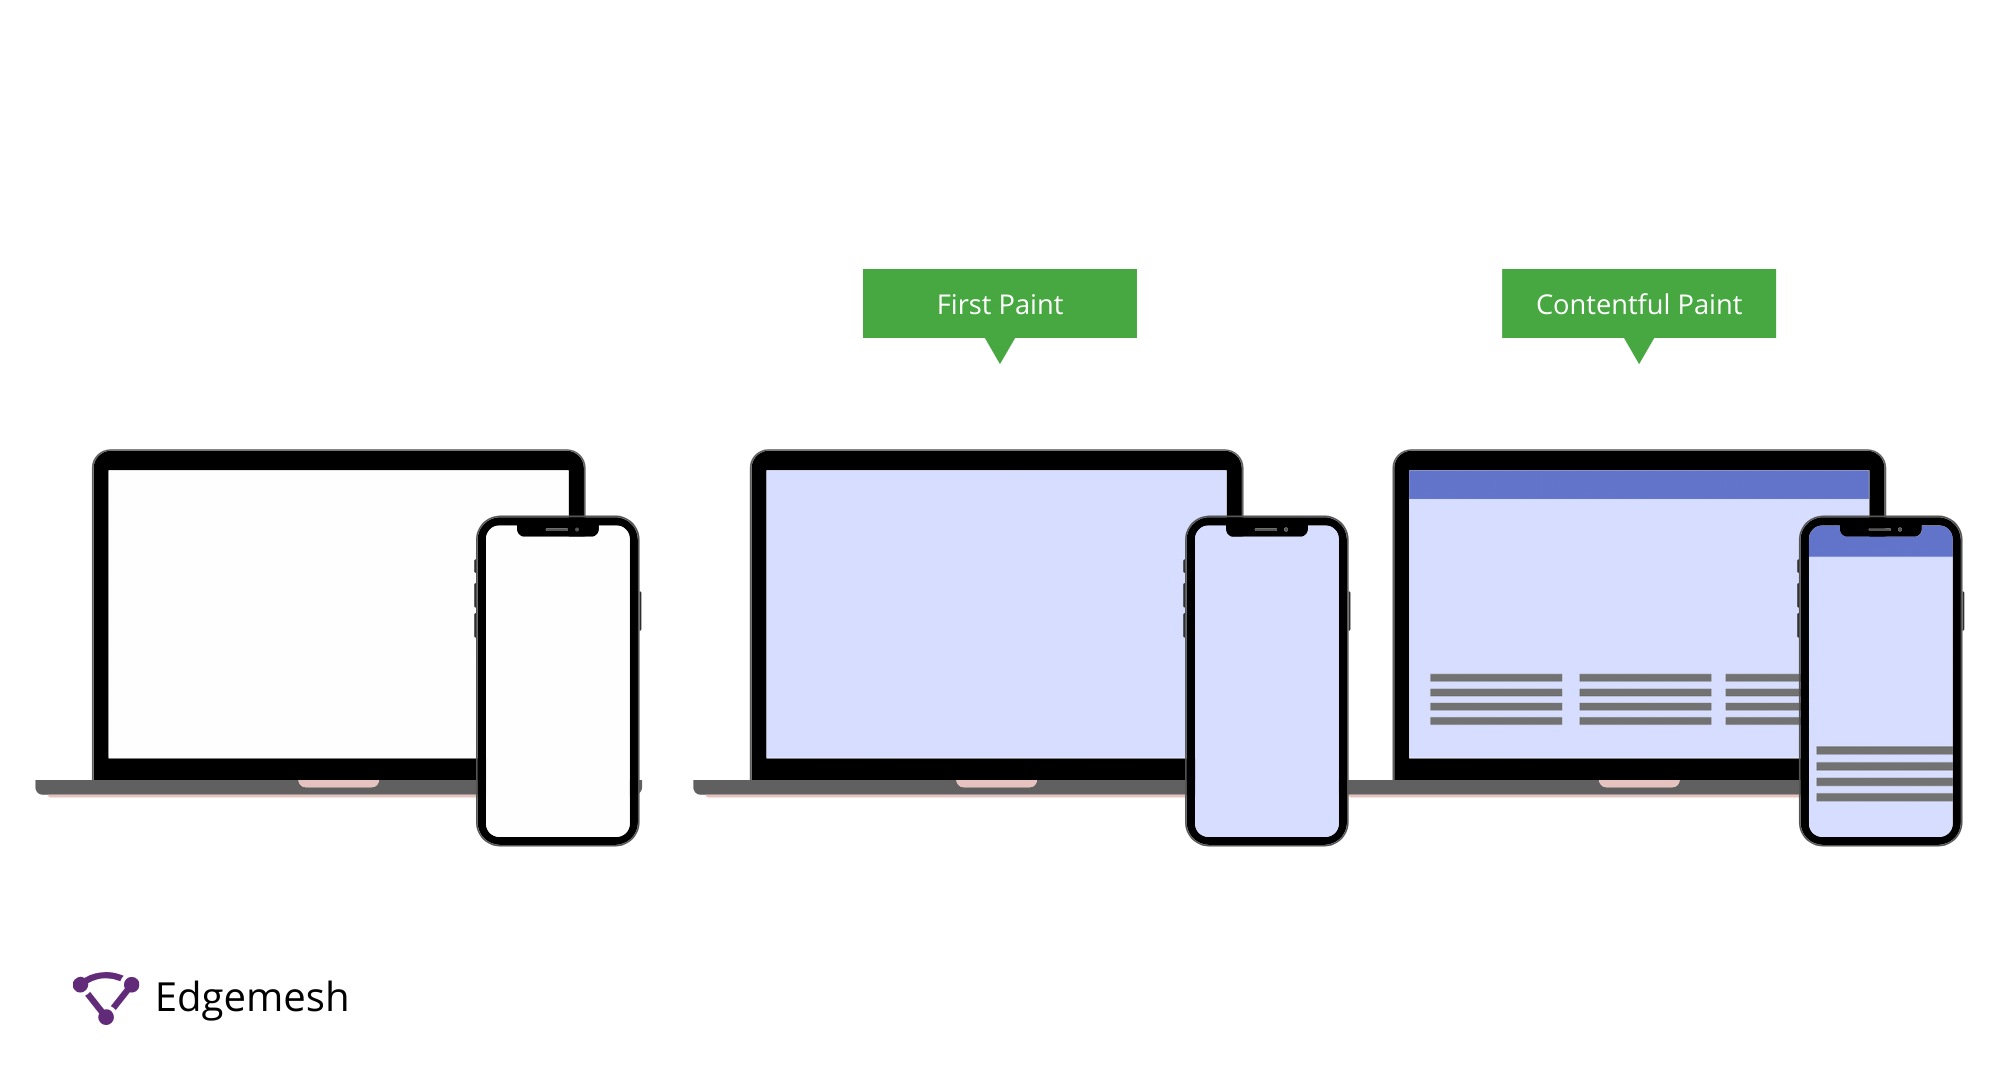
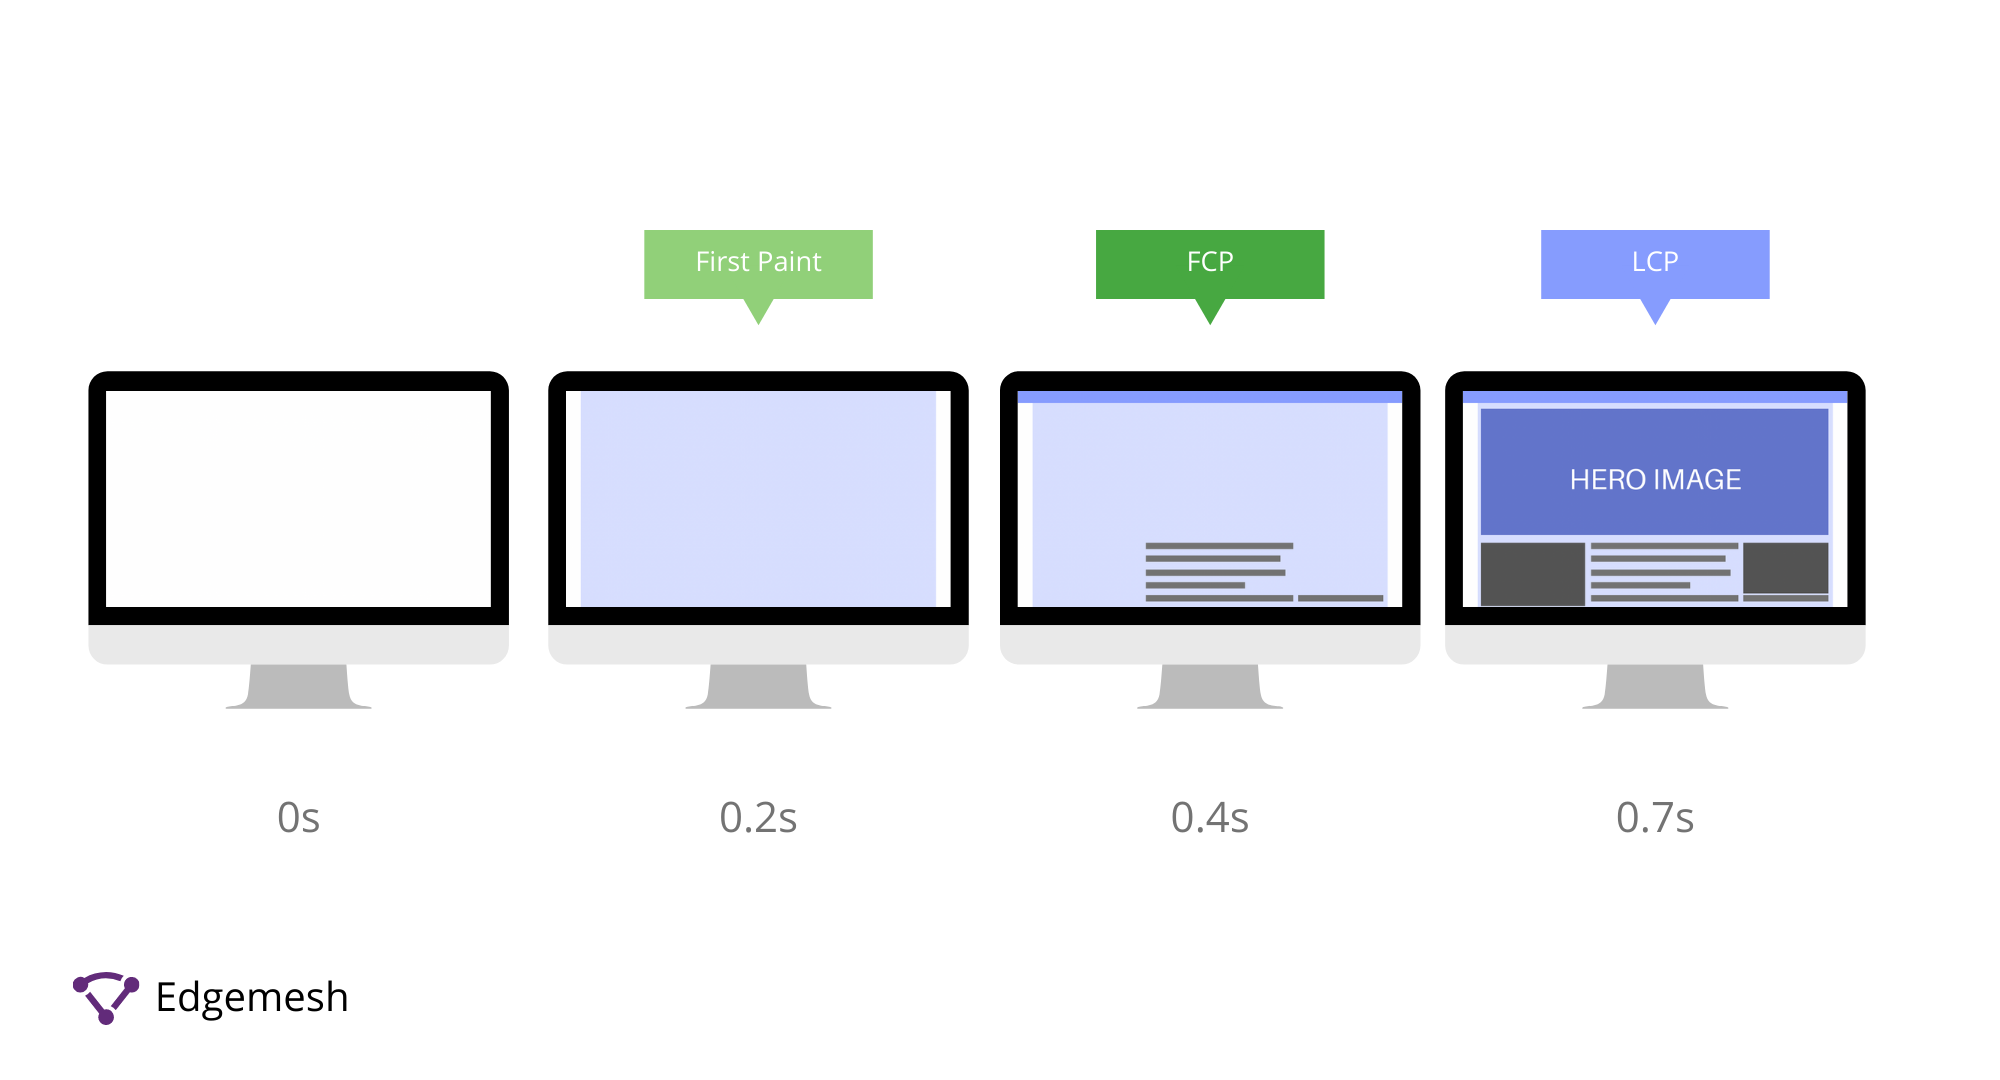
The First Paint (FP) occurs when there’s any change in the current display of your web page. This metric measures the time for the browser to render the first pixels on the user’s screen. Anything rendering in the user’s viewport triggers the first paint.
This metric’s issue is that first paint can easily be triggered early on during the page load event without any meaningful content for users to interact with. In cases where the background color of a website changes, it triggers the FP—even though the main content or any form of interactivity takes longer.
On the other hand, the Contentful Paint focuses on when the first content from the Document Object Model (DOM) is painted.
Bringing these two together, we have the First Contentful Paint (FCP) that measures not just any paint but the first paint with content that users can interact with. And speaking of interactivity, the Largest Contentful Paint is often prioritized over the First Contentful Paint because it accounts for 25% of the overall performance of a website—but both metrics measure different things.
Difference Between The First Contentful Paint (FCP) and Largest Contentful Paint (LCP)
When considering paint-related metrics for measuring your website’s performance, which is more important—the LCP and FCP? Both are important if you know how they work.
Unlike FCP, which measures the time it takes the first content from the DOM to be painted, the LCP is different.
The Largest Contentful Paint (LCP) measures the time it takes the largest DOM content above the fold to load and become visible in the user’s viewport. Unless the LCP loads, the user will likely not fully interact with the page because it hasn’t readily shown any sign of interactivity.
The downside to LCP: it doesn’t consider the elements that load on the web page before the largest DOM content loads—this is where FCP comes in.

FCP serves as the first feedback users get in response to their request for a web page from the browser. With this, FCP can measure the time taken for the first DOM content to load—all based on the user’s perspective.
What’s a Good FCP Score?
According to Google, your FCP should occur within 1.8 seconds or less to provide the best user experience.
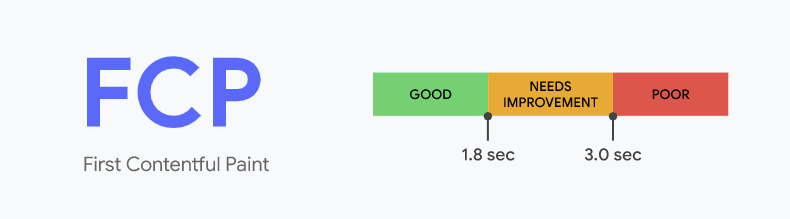
In determining your FCP scores and other metrics, Google compares your FCP time with real websites based on data from the HTTP archive. With this, Google splits the results into three categories, namely — good (green), needs improvement (orange), and poor (red).
- Good — 0 seconds to 1.8 seconds
- Needs Improvement — 1.8 seconds and 3 seconds
- Poor — 3 seconds and above
How to Measure Your FCP
Measuring your FCP can be done either with Lab Tools or Field Tools. Depending on the tools you choose, the results vary, but not widely.
- Using Lab Tools to Measure Your FCP
Checking your FCP with lab tools simulates users’ experience when they visit your website under ideal situations. Some of these simulations include network, bandwidth, latency, and browser configurations.
Examples of lab tools include:
- Using Field Tools to Measure Your FCP
Using field tools provides far more accurate results than lab tools due to how it tracks your page experience to users in real time. This means you’re getting results based on real user experience while on the website.
Examples of field tools include:
Using PageSpeed Insights to Measure Your FCP
PageSpeed Insights is one of the tools Google recommends for measuring your website’s performance. It’s a simple-to-use tool that provides a cumulative score on your overall performance, along with recommendations on how you can improve where you fall short.
To use PageSpeed Insights, go to the website ( https://developers.google.com/speed/pagespeed/insights/) and insert your website’s address.
In this case, the website we’ll be testing is ours—Edgemesh.
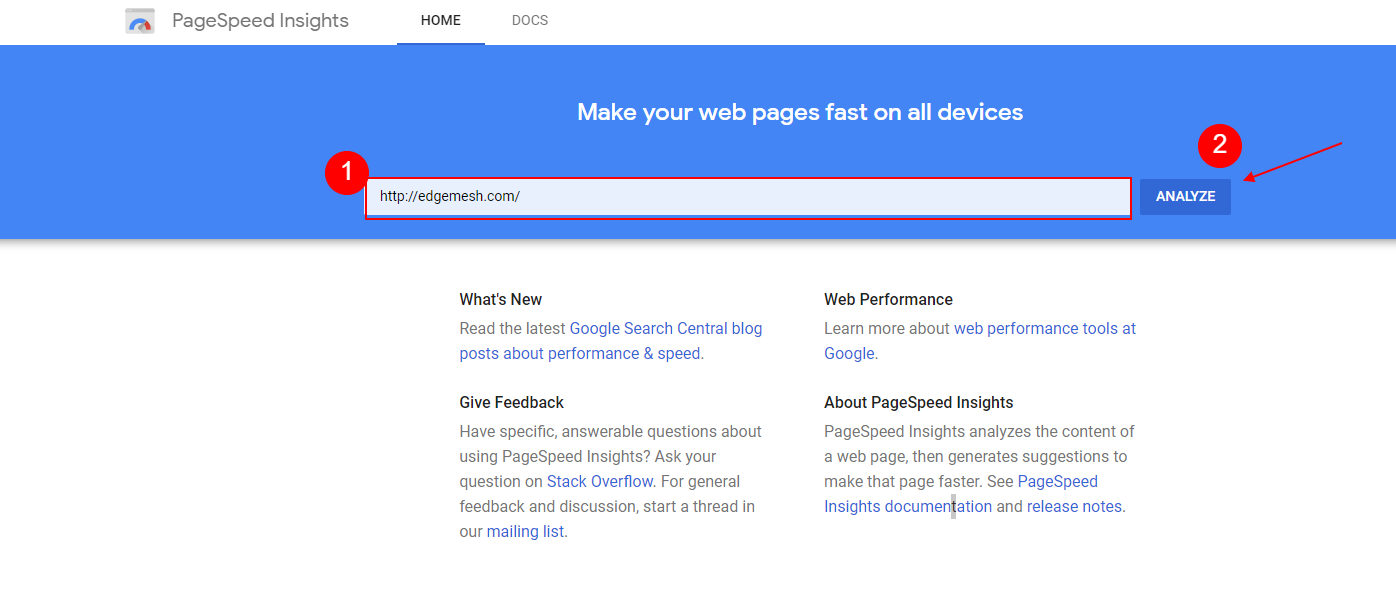
By clicking analyze, the tool analyzes your website’s performance and gives you a score ranging from 0-100 based on the Lighthouse Scoring Guide.
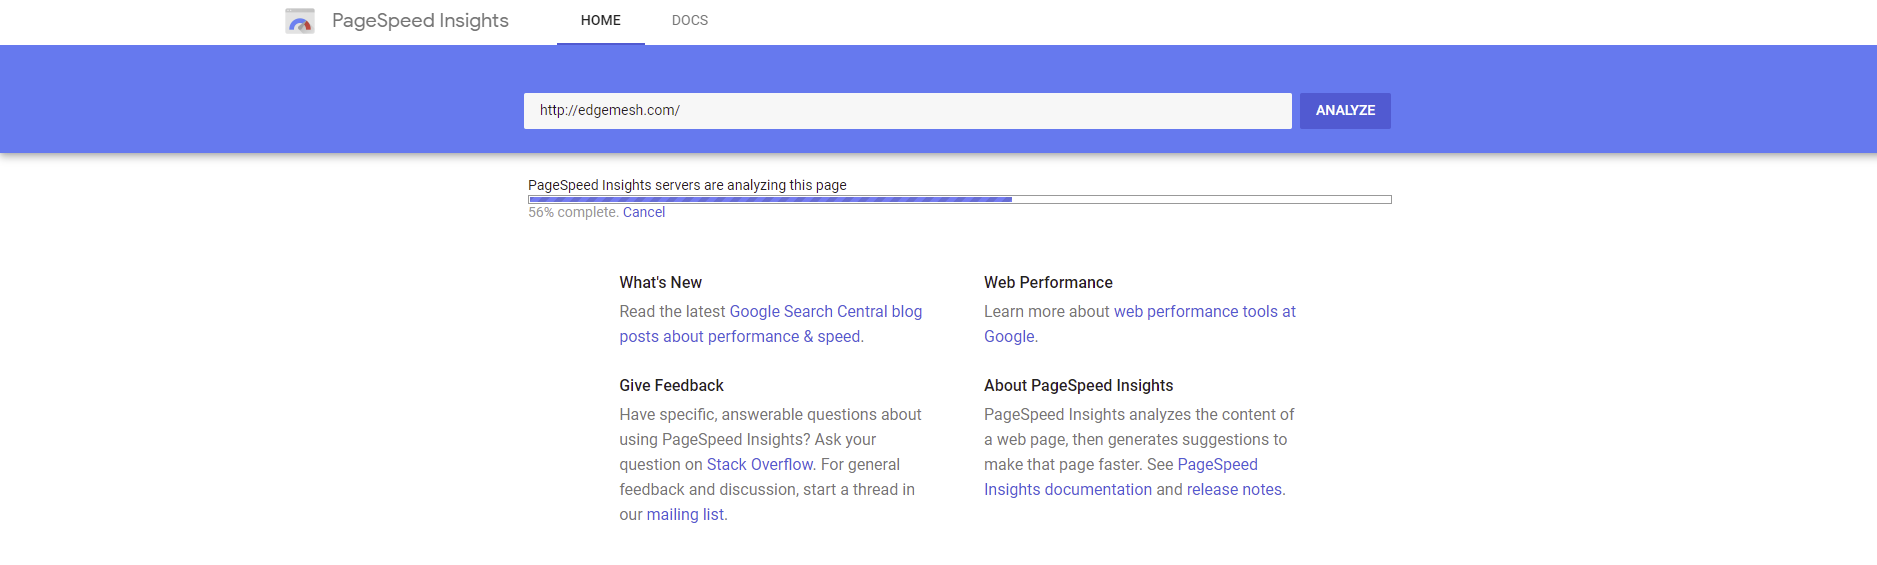
When the page loads, scroll down and see your results—one of which is your FCP score. In testing our website, we had an overall performance of 98/100, and our FCP score was 0.9 seconds.
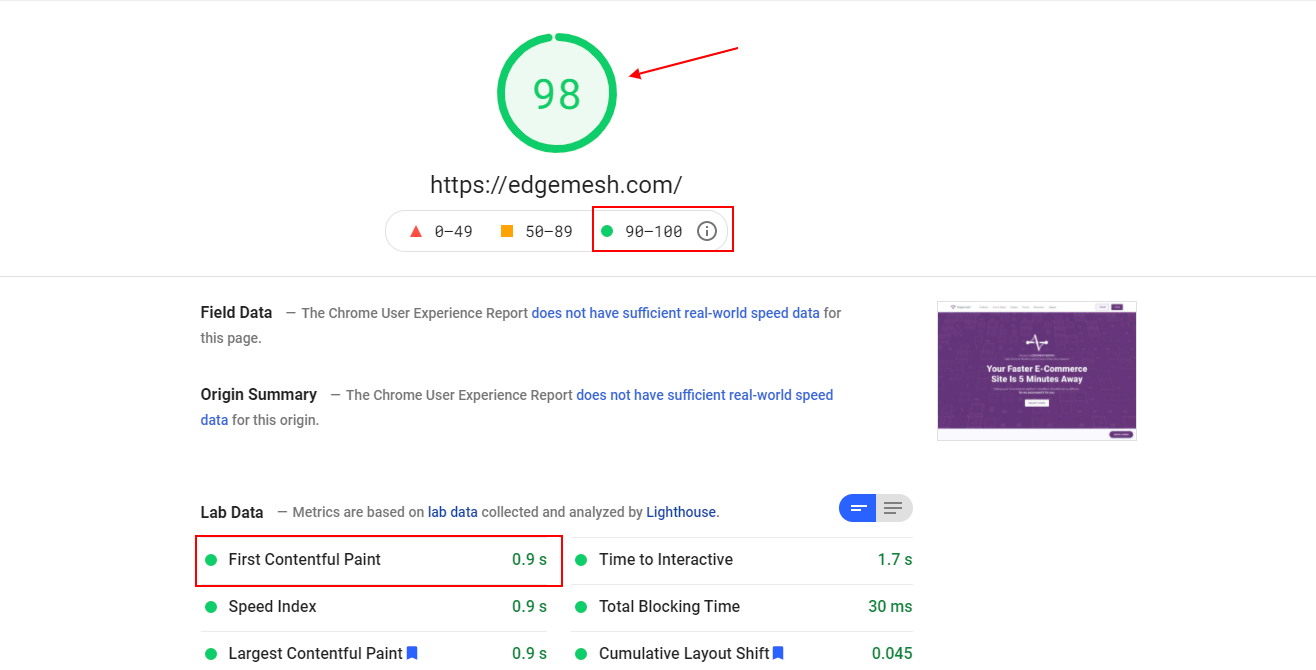
These results put us in the green zone—so we’re on google’s good side.
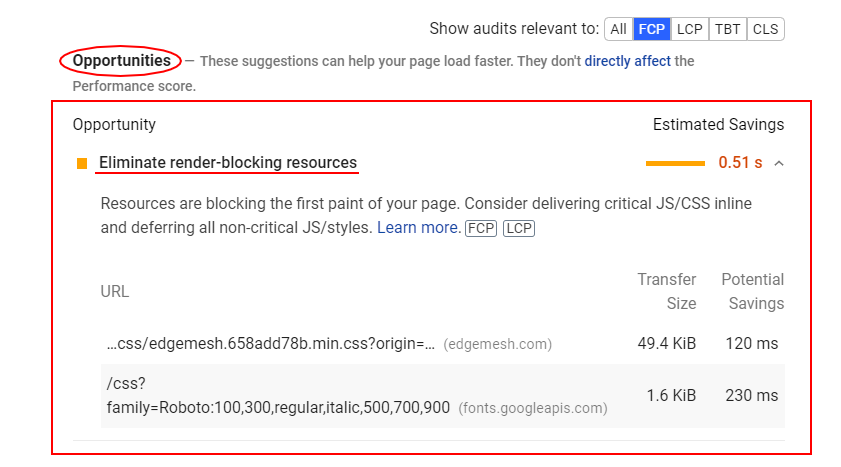
If you have low to mid results for your FCP score, scroll down to the audit section and note what caused it.
In the audit section, you get three categories:
- Opportunities—Suggestions that can help improve your FCP and load your website faster.
- Diagnostics—Complete diagnosing of your current FCP and what you can improve. Here’s where you’ll know exactly what caused the drop in your FCP score.

- Passed Audits— The passed audits are all you did right relative to your current FCP score.
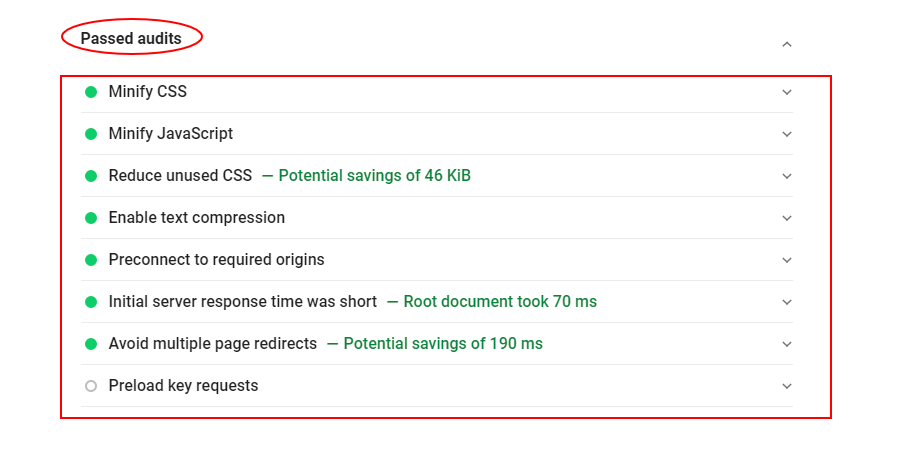
By identifying the drawbacks in your current performance, you can go to your website’s backend and provide the best solution to the problems. Doing this frequently gives you a better chance of providing your users with the best on-page experience—and this trickles down to your bottom line, improving your overall conversion rate.
Using WebPageTest to Measure Your FCP
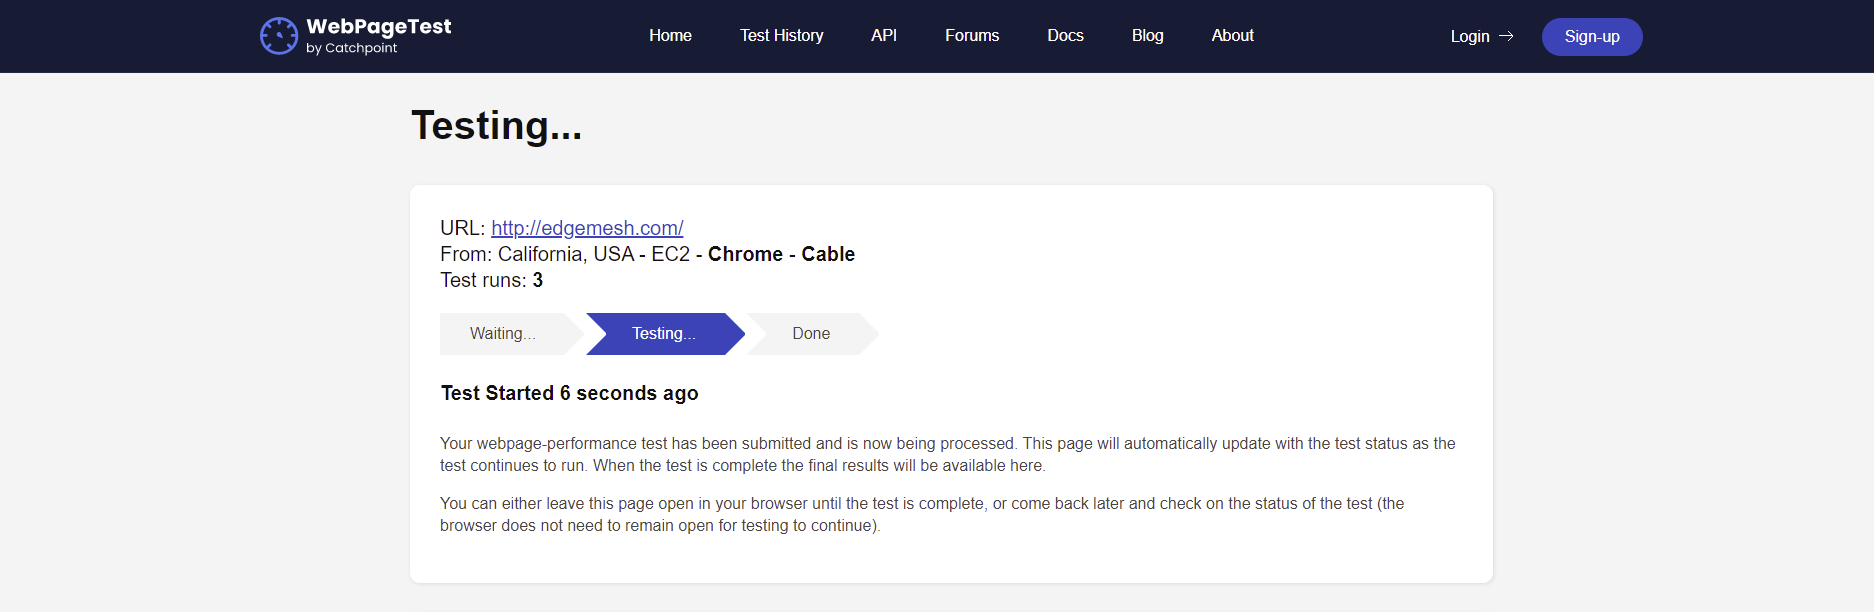
The WebPageTest is a lab tool that allows you to test your website’s performance by emulating any device with your preferred connection. To use WebPageTest, visit the website (https://www.webpagetest.org/) and set your preferred connection (advanced settings) after inserting your website’s address.
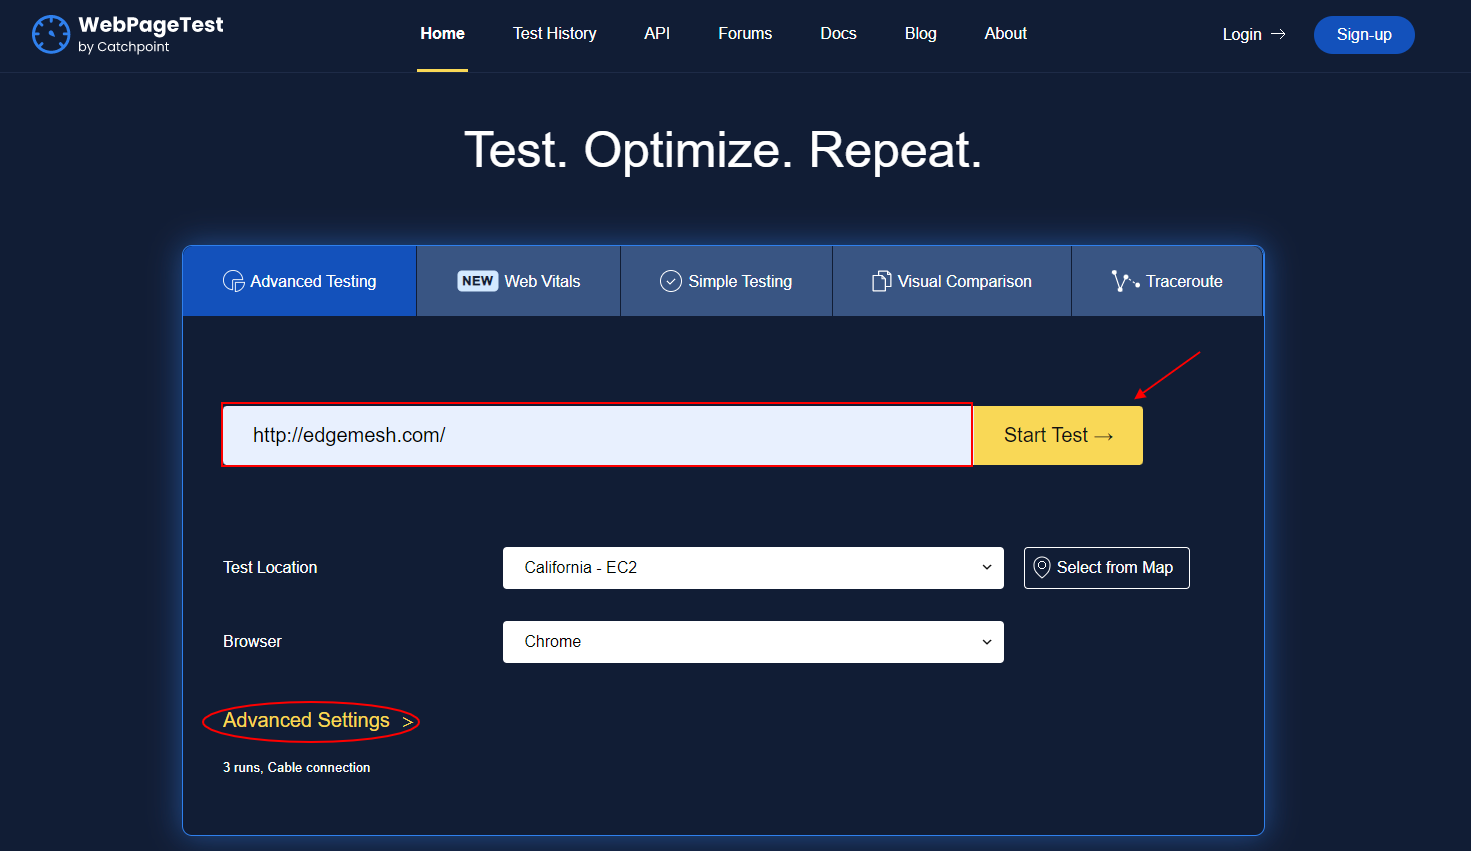
By clicking start test, the tool analyzes your website and provides you with a detailed result of your overall performance—FCP included.
When the test is complete, you get a breakdown of your performance results. For example, we got 0.84 seconds as our FCP score—and remember, we got 0.9 seconds using PageSpeed Insights.
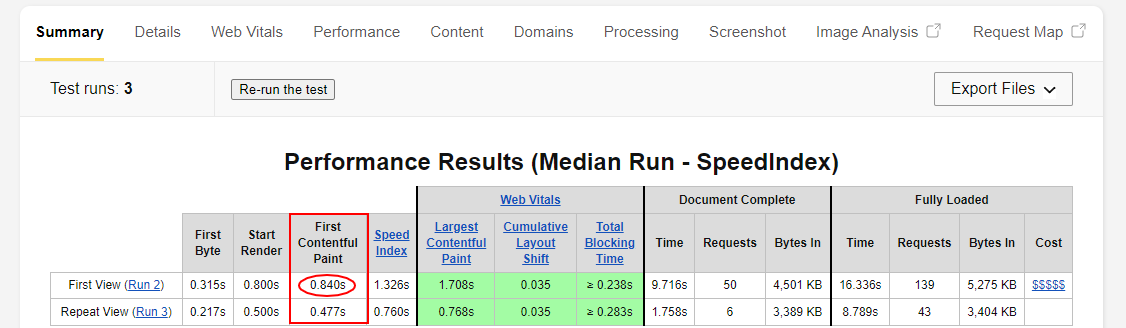
And if you’d like to get more detail, you can scroll down to each “run” and click on “filmstrip view” to see how your FCP score compares to the other metrics of your website.
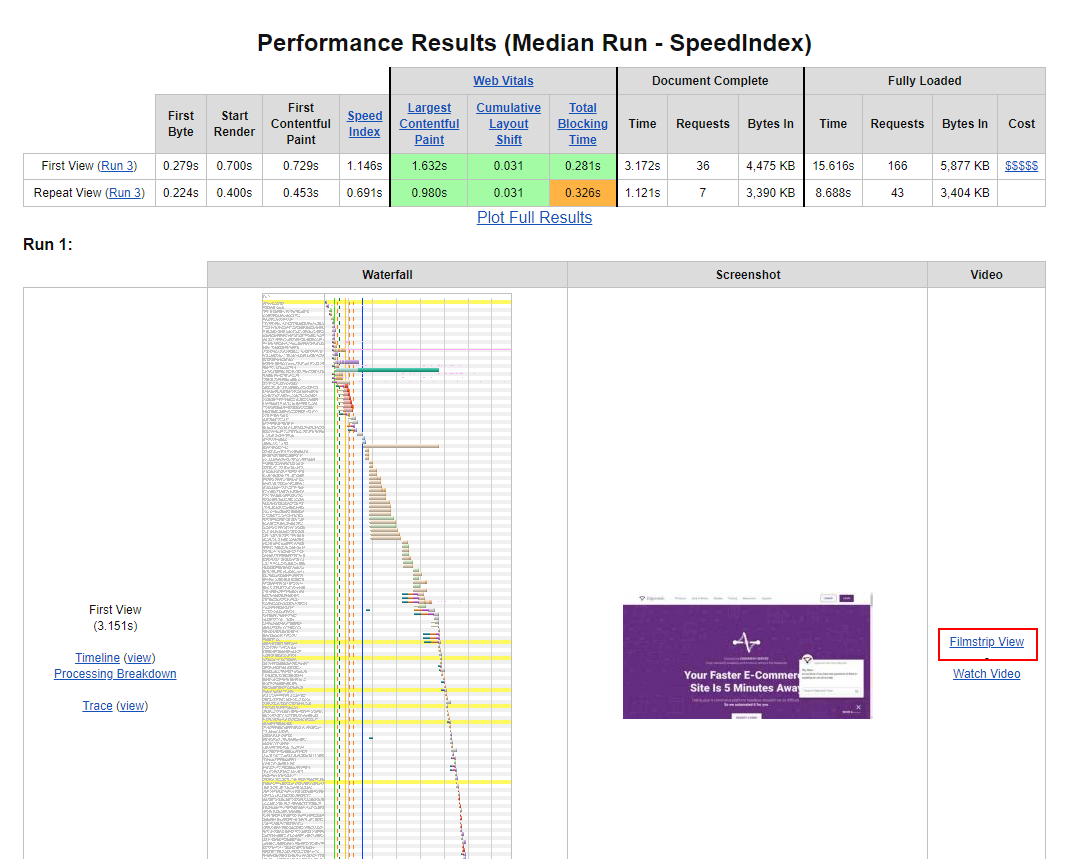
Unlike PageSpeed Insights where you can easily identify factors causing you to have a poor FCP score, the WebPageTest tool doesn’t provide that by default unless you’re drilling down on every process in your entire loading event.
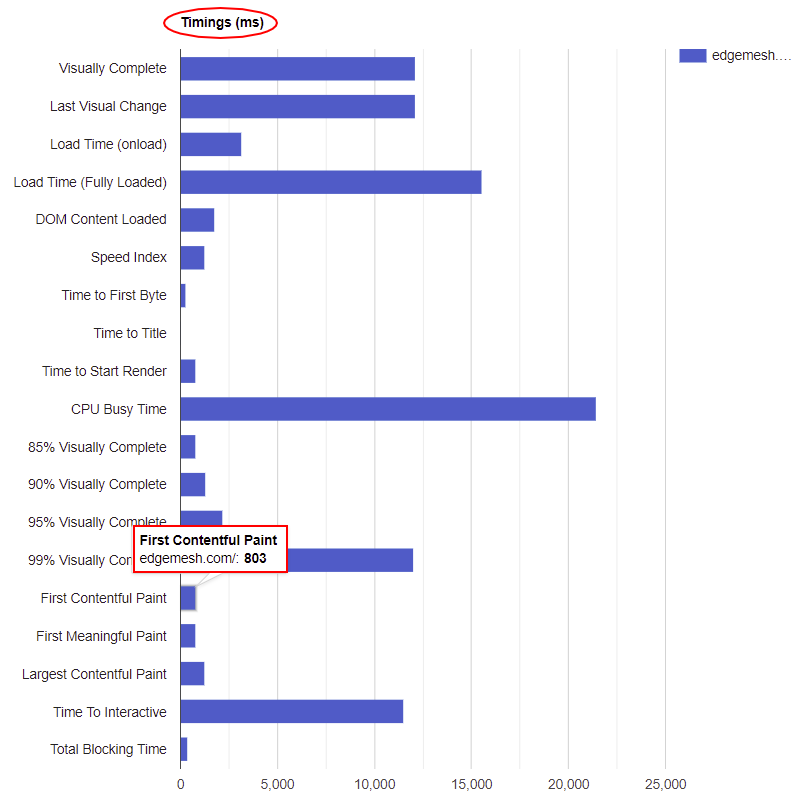
Back to the FCP scores, you can see the difference between the scores from both tools—0.84s and 0.9s. Even though the tools you use will likely be different, the results will always be within a close range for you to understand how to best optimize your website.
7 Ways to Improve your First Contentful Paint
Now that we’ve covered how you can measure your FCP, the next step is knowing the best ways to improve it. Below are seven ways to improve your FCP.
1. Enable Client-side Caching
The problem with a poor FCP is the time it takes before any content renders on the web page. An excellent way to solve this is by caching your website so that you can keep a copy of your website in the nearest accessible place for the user on their next visit.
However, when it comes to caching, there are two types—you can either cache on the server side or client side. By default, most of your website resources and loading events will be from the server side, and the downside to this is the time it takes for the server to respond to the browser’s request.
By caching on the client side, you’re keeping a copy of your web page on the user’s device without the need for the user’s request to go back to the origin server before it displays. When you do this, there’s a reduction in the overall workload done by the browser and the server. This will create an instant boost in your FCP score and overall website performance.
For the best client-side caching provider, Edgemesh Client gives your users a good on-page experience.

2. Reduce Your Time To First Byte (TTFB)
Time to First Byte (TTFB) is a web performance metric that measures the responsiveness of a website’s server to the browser request.
This metric determines how fast the server responds to a request. You can take the TTFB as the “server response time.” If it takes a long time for the server to respond to a request, the FCP will always be slow regardless of optimization.

FCP and all other metrics on your website depend heavily on your TTFB—to be safe, aim for a TTFB of 0.1-0.2seconds. If your TTFB is higher than that, then try improving your HTTP request and response time and request processing time.
3. Eliminate Render-Blocking Resources
The term render-blocking resources is anything that interrupts the painting of the first DOM content. Before a website can render in the user’s viewport, the HTML document representing the website contains Javascript and CSS files that must function properly.
When there’s a request for a web page, this HTML needs to parse, read the HTML document and then construct the DOM before it renders. If this process is successful, without any interruption, the website will render without any issue.
Rendering can be interrupted or slowed down when CSS and Javascript files block the main thread. When this happens, your website becomes inactive, and there won’t be any DOM content to paint—thus giving you a poor FCP score.
To get a better FCP score, here are ways to eliminate render-blocking resources,
- Defer the Javascript Loading
- Minify your Javascript and CSS files
- Combine your sub-js and sub-CSS files into a master file so they can be parsed as one
4. Generate Critical CSS and Inline It
CSS is responsible for styling your website the way you want it to be. So, CSS makes anything relating to colors, layout, and fonts possible. It also makes your website presentable and accessible on screens of different devices.
There are two ways you can set CSS to load when your website loads—either Defer the CSS or let it load Asynchronously.
If you load your website’s CSS asynchronously, your website will display in an unstyled manner, i.e., your website won’t render in the order in which it appears. When this happens, you get a poor FCP score because even though it loads on time, your website doesn’t give users the perceived load speed.
On the other hand, deferring your CSS allows the browser to execute the styles that appear in the markup.This doesn’t mean issues like Flash of Unstyled Content (FOUC) won’t occur and give users a bad experience. The best way to prevent this is to generate critical CSS and inline it directly in your HTML file. This lets your page display main elements like your site header, logo, and default text without the need to load your CSS file fully.
5. Don’t Lazy Load Images Above the Fold
Lazy loading images is a common technique used to speed up websites. This means deferring loading images that aren’t visible in the user’s viewport. When the user scrolls or gets to a place on the web page where it needs this image, the image loads.
The downside to this technique: it affects your FCP if you do it for above-the-fold images. This is because the script that makes lazy loading works is Javascript—and during the initial page load, if the Javascript task doesn’t fully execute, the main thread will be blocked.
As a result, try and exclude above-the-fold images. Several plugins like WpRocket have this feature and can help you exclude images, image classes, image sources, and even avatars.
6. Reduce Your DOM Size
Your DOM (Document Object Model) is a representation of your entire web page. DOM is structured in a way that allows for all objects pertaining to the function of a website to be directly inside the DOM tree.
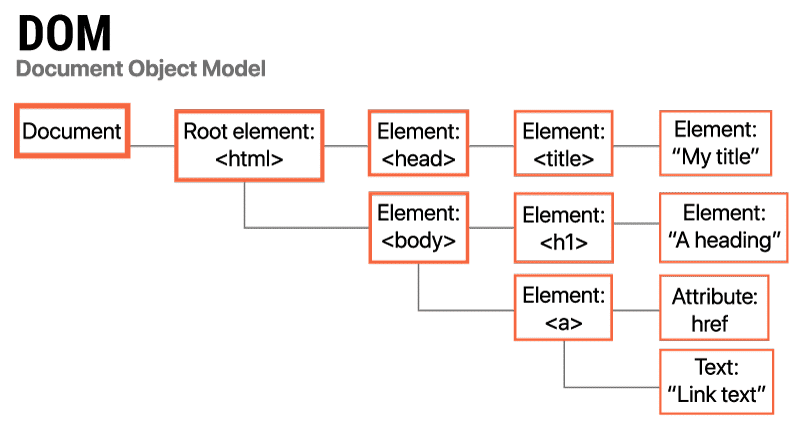
In a DOM tree, all HTML elements are called nodes. These nodes are able to branch out into multiple elements without any limits. How deeply these nodes branch out is called the node depth. The sum of each node depth is called the tree depth. The main element of each node is called the parent element, and all of the nodes under that element are called the child element.
This breaks down the structure of the DOM tree. If your DOM tree is large and unoptimized, there’ll be many nodes invisible to the user during the initial page load event. There’s a slow processing time in the backend for the browser to parse and render each node when this happens. The time taken for elements to render will cause your FCP to drop as a result.
Google’s browser engineers recommend pages containing fewer than 1,500 DOM elements, a tree depth <32 elements, and fewer than 60 children/parent elements.

If your website exceeds these requirements, you’ll be penalized, affecting your FCP score and overall web performance.
Below are five ways you can reduce your DOM size:
- Avoid the excessive use of <div> tags from plugins, themes, and page builders
- Remove unimportant content on the web page
- Split large pages into smaller ones
- Choose optimized themes
- Lazy load elements—not just images
7. Avoid Multiple Page Redirects
When users visit your website, it redirects them to another URL. The server will return an HTTP 301 redirect status code response.
HTTP/1.1 301 Moved Permanently
Location: /path/to/new/location
When this happens, the browser must make another request to the new location to give an actual response to the user’s main request. This extra round trip time creates a network latency that affects your FCP and delays the rendering of any paint on the website even though it loads.
Multiple redirects like that can delay the loading and rendering of resources by hundreds of milliseconds.
Lighthouse flags web pages with two or more redirects.
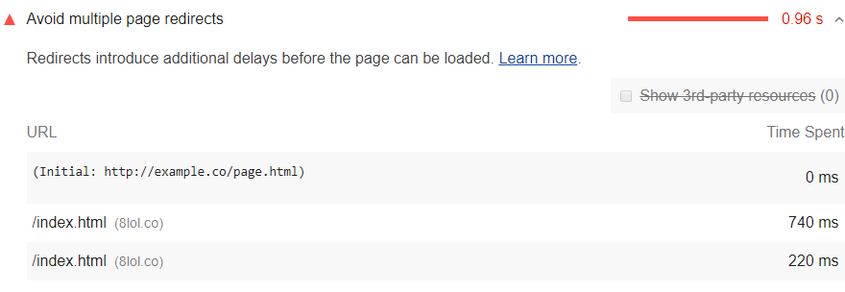
The best way to eliminate these redirects is to point the flagged resources directly to their final destination instead of going through an unnecessary round trip.
On a Final Note
FCP is a vital metric in the overall performance, especially as it solely focuses on user experience. Having a poor FCP score, i.e., above 3 seconds, shows a bad user experience, leading to an increase in bounce rates. The best way to avoid this is by following the methods we’ve discussed in this article and make the best of your website experience for users.
Quick question, what is your current FCP score, and what are you looking to improve?
We’d be happy to hear from you.
If you made it to the end of this article, that means you’d be interested in the rest of this series.
Below are related articles we think you’ll find helpful:
The Complete Guide to Google’s Core Web Vitals: What is Largest Contentful Paint (LCP)?
Complete Guide on First Input Delay (FID)
What is Start Render Time, and How Can You Improve It?
What is Cumulative Layout Shift (CLS)?
5 Reasons Why Client-Side Caching Is Best For Your E-Commerce Website
What is Total Blocking Time (TTB)?
Do customer experience, good conversions, low bounce rates and overall, speed matter to you? Then you’ll love Edgemesh’s Enterprise-Grade Web Acceleration.
Our intelligent, automated, and next-generation client-side caching readies your website to move at full speed—with just a single line of code.
Plus, it takes less than 5 minutes to set up. What do you say?
Start your 14-day trial to get a feel for what page speed means to your business.


